Market analysts have historically relied on the head-and-shoulders pattern. We'll explain how to profit from this pattern below.
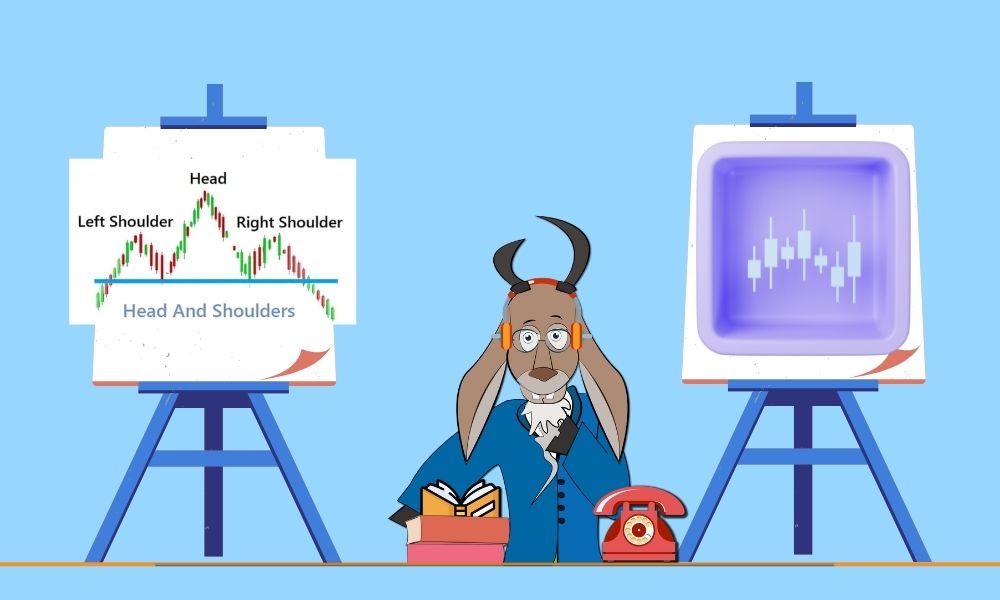
The head and shoulders pattern is a chart formation in technical analysis that indicates a trend reversal. This pattern is a reliable indicator of trend reversal.
Before proceeding, remember that the head and shoulders pattern is almost never perfect, meaning there will almost always be small price fluctuations between the shoulders and the head.
Head-and-shoulders patterns can also shift from bearish to bullish. This is an inverse head-and-shoulders pattern, or an upside-down one. The inverse pattern indicates a market upturn.
In an inverse head and shoulders pattern, stock prices fall three times and then rally twice. The middle valley is the deepest, while the shoulders are shallower.
Once the second shoulder forms and breaks above the neckline, prices will rally, indicating that the bearish trend has reversed and bulls will likely take control of the market.
Once the neckline is crossed, the head and shoulders pattern helps traders estimate price targets. Stop-loss orders can be placed easily.
When a head and shoulders pattern is present, stops are placed above the head's high. Stops are placed below the head's low price in an inverse head and shoulders pattern.
To estimate price movement after the neckline is broken, measure the distance from the head to the neckline. After the second shoulder forms, subtract the same distance from the neckline in the opposite direction, starting where prices crossed.
If the neckline represents $20 in a stock's price, analysts expect the stock to drop at least $20 once the neckline is broken. Many traders believe prices will fall at least this much, though it's only an estimate.
In a traditional head-and-shoulders pattern, you measure the vertical distance from the head to the neckline to estimate the spread. Inverse patterns are the opposite.
Calculate the distance from the head to the neckline to estimate price increases.
Head and shoulders patterns must be completed before trading. You shouldn't assume a forming pattern will fully develop and trade accordingly.
Keep an eye on emerging trends and be patient in volatile markets. Avoid overconfidence. Plan ahead so you can act when the neckline breaks. Variables may affect your entry, stop, and profit targets.
Traders use an alternative entry point, but it requires diligence, patience, and swift action. Traders using this approach observe the pattern and wait for prices to retrace above the broken neckline.
This trade allows traders to enter at a lower price. If you wait for a retracement that never comes, you may miss the trading opportunity.
Stick to trades that respect your risk tolerance and trading goals. Head and shoulders has historically been reliable in an unpredictable space.
It's also easy to recognize. No chart pattern is 100% accurate, but the head and shoulders pattern accurately predicts a major trend reversal.

